September 25th, 2023
Improved
Fixed

🔄 September 25th, 2023 Release
Improvement
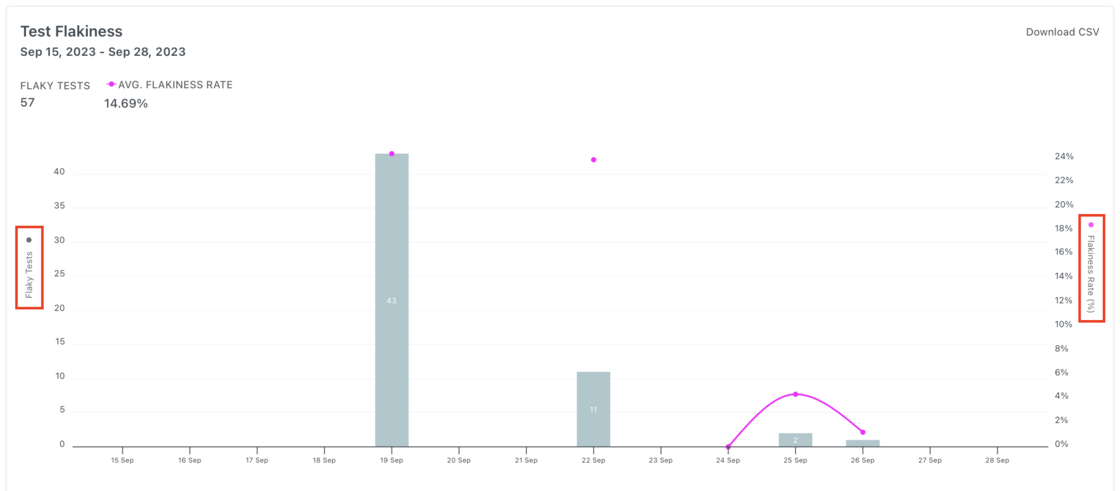
Improve flakiness rate visualization in the Test Flakiness graph (Analytics). Now, the Test Flakiness graph presents a more readable scale for small flakiness rates. The graph shows the number of flake tests on the left side of the graph and the flakiness rate on the right side [CSR-771].
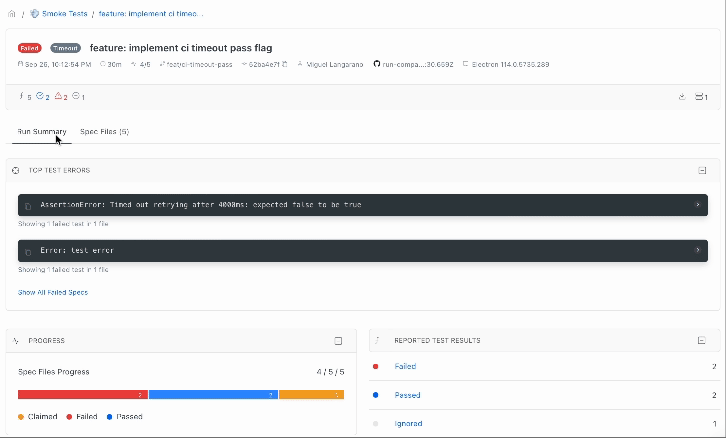
Filter by group in the Spec Files Tab [CSR-694].
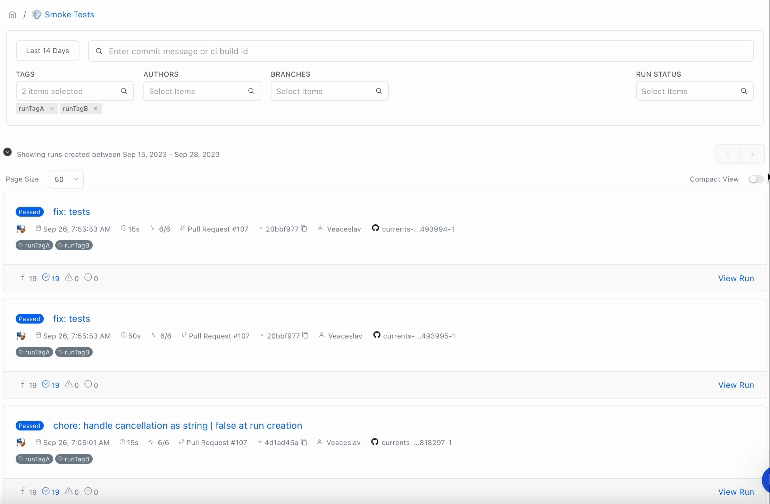
See Tags on the Compact Runs View [CSR-697].
Fix
Prevent invalid billing emails through a validation mechanism before saving them on Billing & Usage [CSR-773].