May 22nd, 2026
We've released @currents/playwright 2.0 with full support for Playwright 1.60 and newer.
We've updated the orchestration workflow to use two commands for better control over test discovery and execution.
Playwright 1.60+ support: Now fully compatible with the latest Playwright versions
Improved workflow: Separate test discovery (
pwc-p discover) from orchestration execution (pwc-p run)Better filtering: Apply Playwright filters (
--grep,--last-failed,--project) before orchestration
⚠️ Migration Required
If you're using Playwright 1.60+, you must upgrade to @currents/playwright 2.0. The orchestration workflow has changed to a two-step process. See the migration guide for detailed instructions.
April 28th, 2026
New

You can now add guests to your Currents organization without consuming a billable seat. This makes it easier to bring in stakeholders, reviewers, and cross-functional teammates while keeping paid seats reserved for people who need full write access.
Invite teammates as Guests even when billable seats are full
Keep billing and seat limits focused on billable members only

This should make it much easier to collaborate with engineering managers, QA leads, support teams, and other stakeholders who need visibility into test outcomes without taking up a paid seat.
April 16th, 2026
Organization admins can now set a hard cap on how much extra usage is allowed beyond your plan limit before Currents pauses recording new results.
Enable Limit Extra Usage in Billing & Usage
Set a cap as a percentage of your plan limit (e.g. 0%, 50%, 100%)
CI pipelines and test runners keep running — only recording pauses
Recording resumes automatically when the usage cycle resets, the cap is raised, or the plan is upgraded
Available now for all customers on extra usage plans

Previously, exceeding your plan limit meant accumulating extra usage fees with no upper bound. With the new cap, you decide the ceiling up front — set it to 0% to stop the moment you hit your plan limit, or to 50% to allow a buffer (for example, up to 15,000 recordings on a 10,000 plan) before recording is paused.
When the cap is reached, your tests continue to run in CI without disruption — Currents simply stops ingesting new results until the next cycle, or until you adjust the cap or upgrade the plan.
This makes budgets predictable while keeping pipelines unaffected.
March 25th, 2026
Action Notifications help your change or approach expiration -- before surprises hit your pipeline.
Configure delivery once per project, then get alerts in Slack, email, or both, only for the lifecycle events you care about.
Slack — Send to a single project channel (uses your existing Slack connection); pick which events trigger a message
Email — Notify the action creator, org admins, and actions admins, plus optional extra addresses; same event controls as Slack
Fine-grained events — Choose from creation, disable, re-enable, archive, expiring soon (advance warning before expiration), and expired
Where to configure — Actions → Settings in the dashboard, alongside the rest of action management (separate from run-level Slack notifications)
Available now for organizations using Actions
Open Actions → Settings, connect or confirm Slack if you use a channel, turn on Email if you want inbox alerts, then select events. Teams that rely on time-boxed quarantines or expiring skips can lean on expiring soon and expired so ownership and cleanup stay visible without manual polling.
March 25th, 2026
Improved
Teams use Currents Actions to conditionally skip, tag, or quarantine tests, so PRs stay green, and teams and teams aren’t blocked on known flakes or temporary exceptions.
In this release we’ve made Actions easier to trust and debug by surfacing affected tests in two places.
On each Action, you can see which tests it hit in your chosen window, open recent executions, and tie them back to the commits they ran on.
Actions → Affected tests has a project-wide list of tests touched by Actions, with filters and a drill-down so you can see which Actions fired and when—without hopping or guessing.
See which tests each Action touches
Open any Action and scroll to Affected Tests to see tests that matched in your chosen time range
Tune the lookback window to focus on recent runs or a longer history
Expand a test to view recent executions where this Action applied

See all the tests affected by an Action
Open Actions → Affected tests for a project-wide view: every test that matched an Action in your lookback period, with the Actions that applied on each test in one place.
Use Action status and Action type filters to narrow to active rules, skips, quarantines, tags, or other behaviors you care about
Search by test title, spec file, or action name to jump to a specific case

This makes it easier for admins and contributors to reason about Actions in context: fewer surprises in CI and faster answers when someone asks, “which tests is this rule actually hitting?”
January 29th, 2026
New
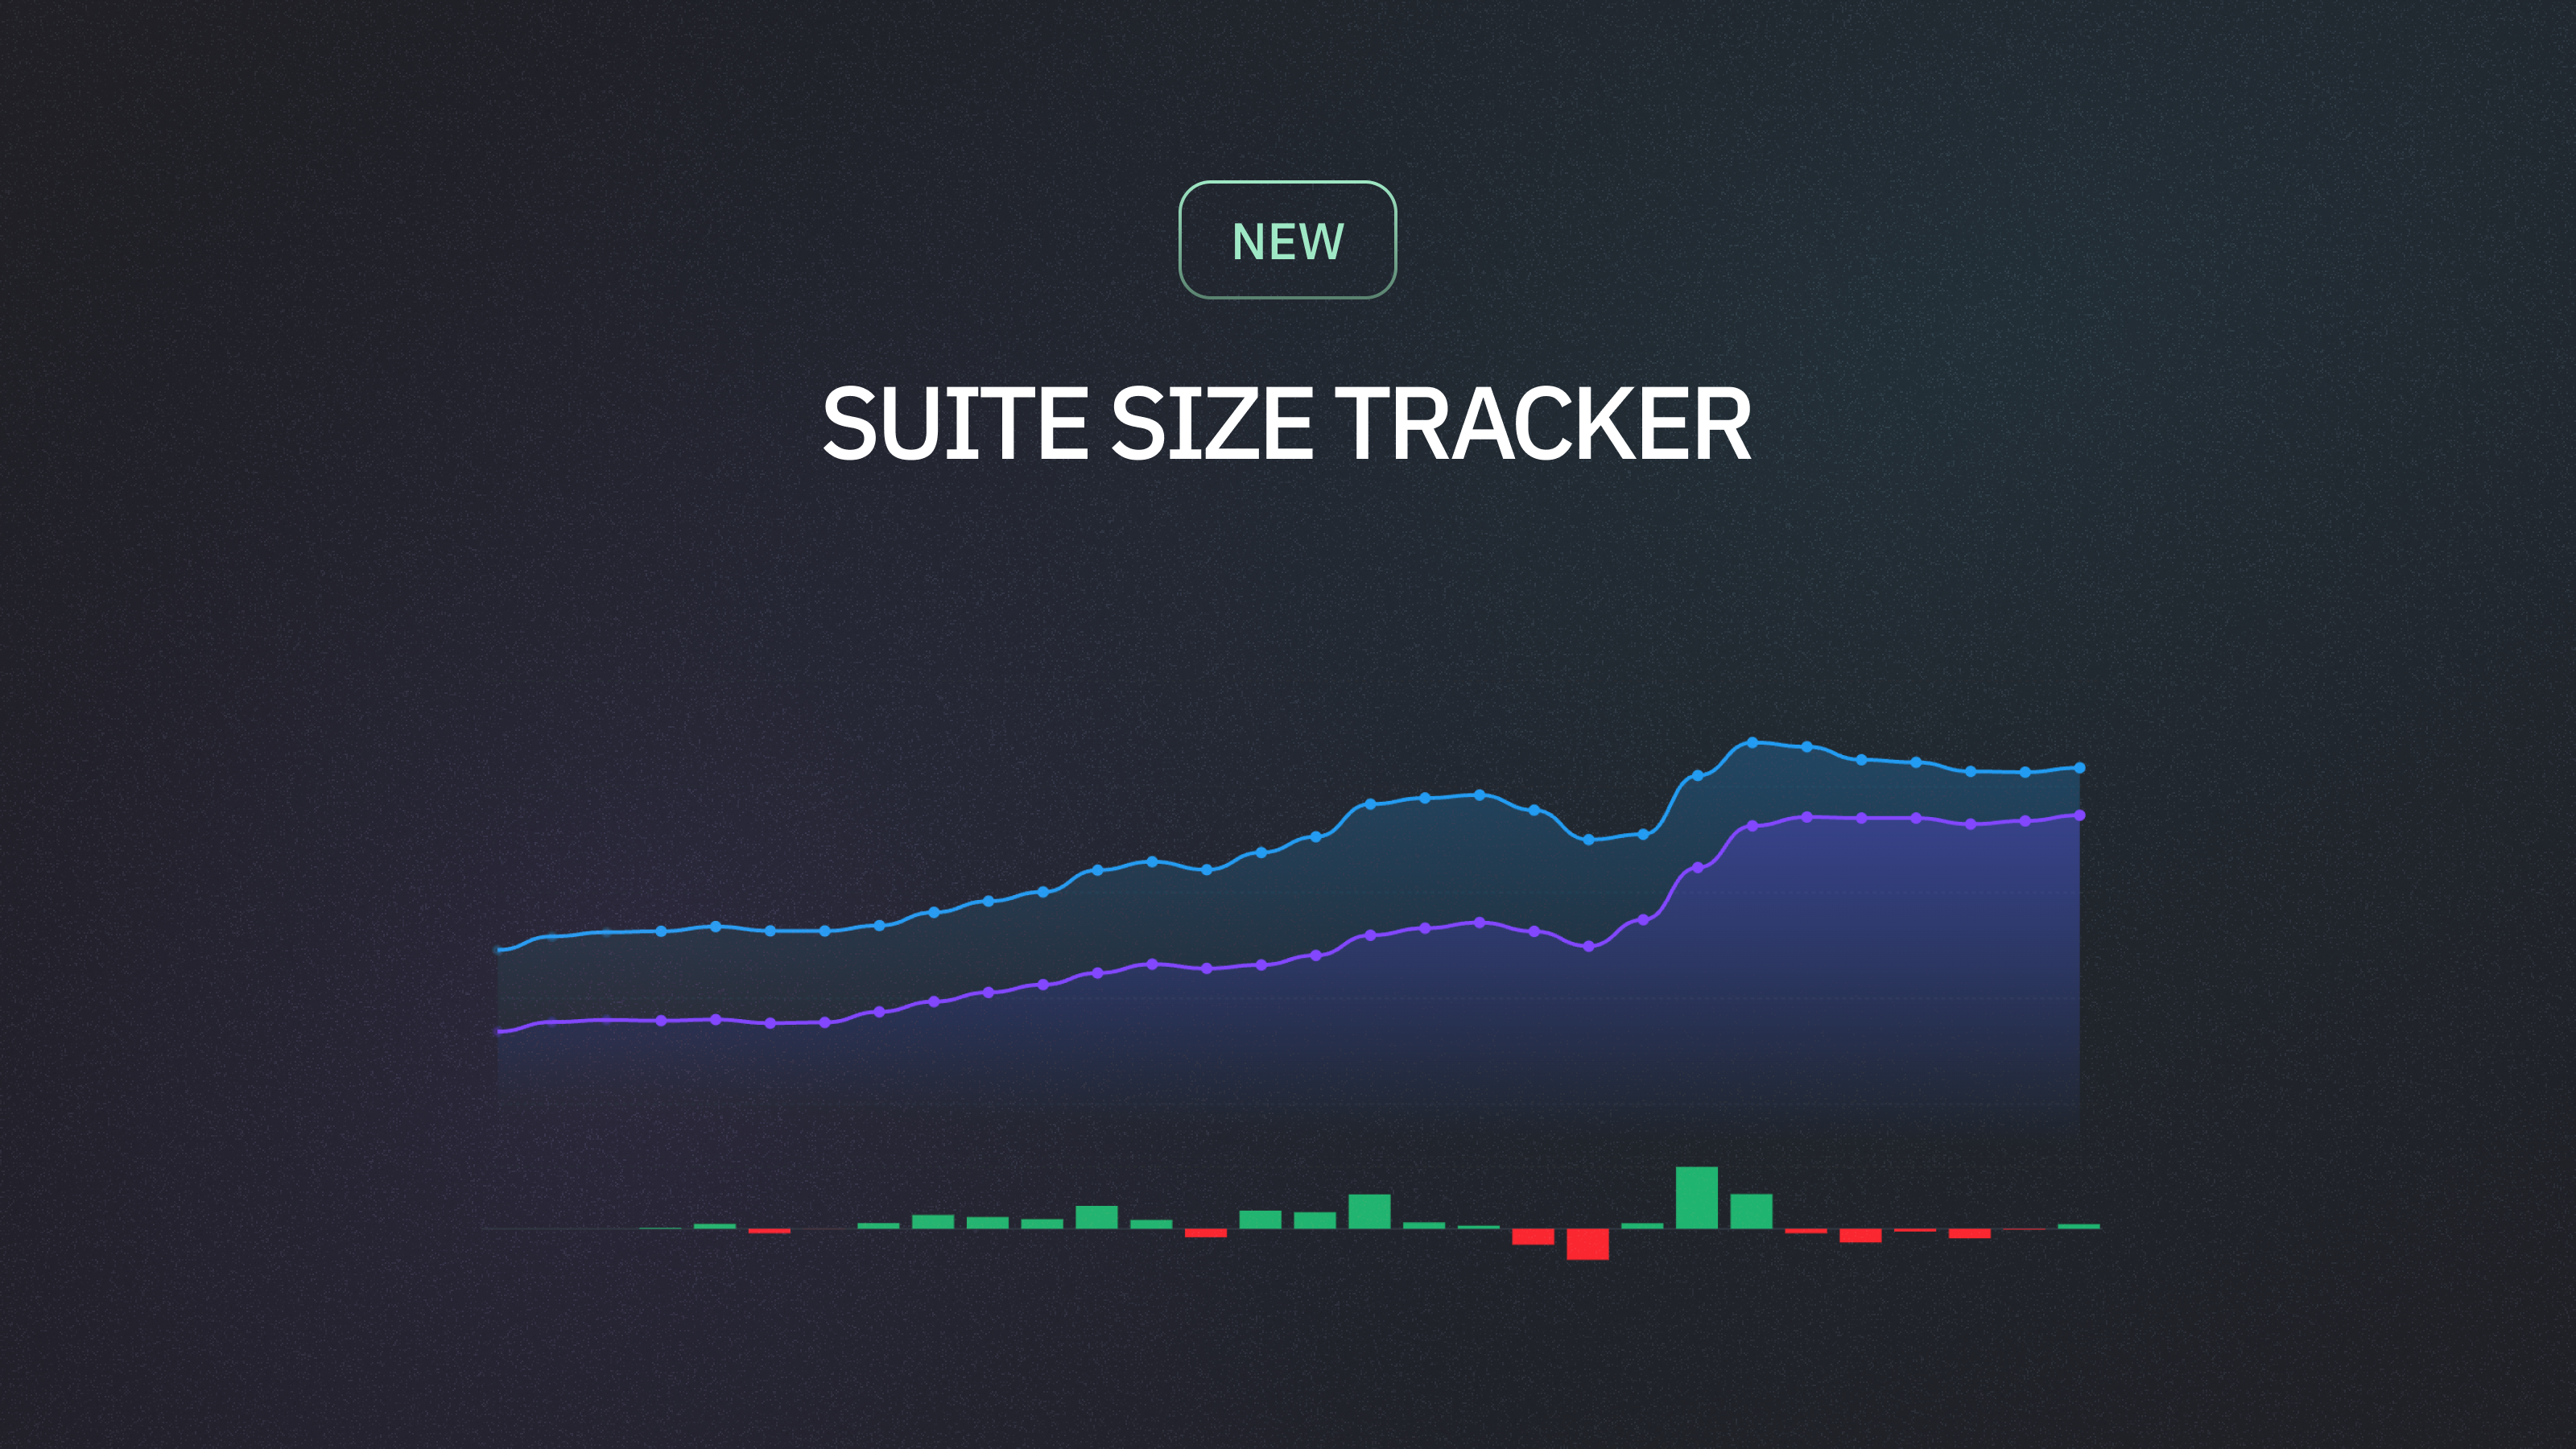
Introducing Test Suite Size, a new analytics view that helps you track how your test suite evolves over time. Whether you're expanding coverage, refactoring tests, or debugging unexpected changes, this view gives you complete visibility into your test suite's composition.
Track unique test cases and spec files discovered across all CI runs
See exactly when and what tests were added or removed from your suite
Monitor test growth by branch, tag, or team with flexible grouping
Use rolling presence mode to smooth daily fluctuations from partial runs
Drill down into any period to see the specific tests that changed
Available now for all customers

Unlike run-level metrics that show tests per individual execution, Suite Size aggregates unique tests across all runs in each period. This means you get an accurate picture of your actual test coverage—not just what ran in a single CI job.

The expandable metrics table lets you click into any time period and see exactly which tests were newly detected or no longer running. Combined with grouping by Playwright tags, Git branches, or test groups, you can track coverage evolution across different parts of your codebase.
For teams with tests that don't run every day (scheduled tests, branch-specific tests, or selective execution), the Rolling Presence mode provides a stable view by counting tests seen within a configurable window—helping you distinguish real changes from normal variance.
January 29th, 2026
Improved
You can now delegate action management without granting full admin access. The new Actions Admin role gives team members the ability to create, edit, and delete Actions.
This role is ideal for QA leads, DevOps engineers, or team members who need to configure test actions without full administrative privileges. Admins can invite new members as Actions Admins or update existing member roles from the Organization Settings page.

Read more about permissions and roles
January 27th, 2026
New
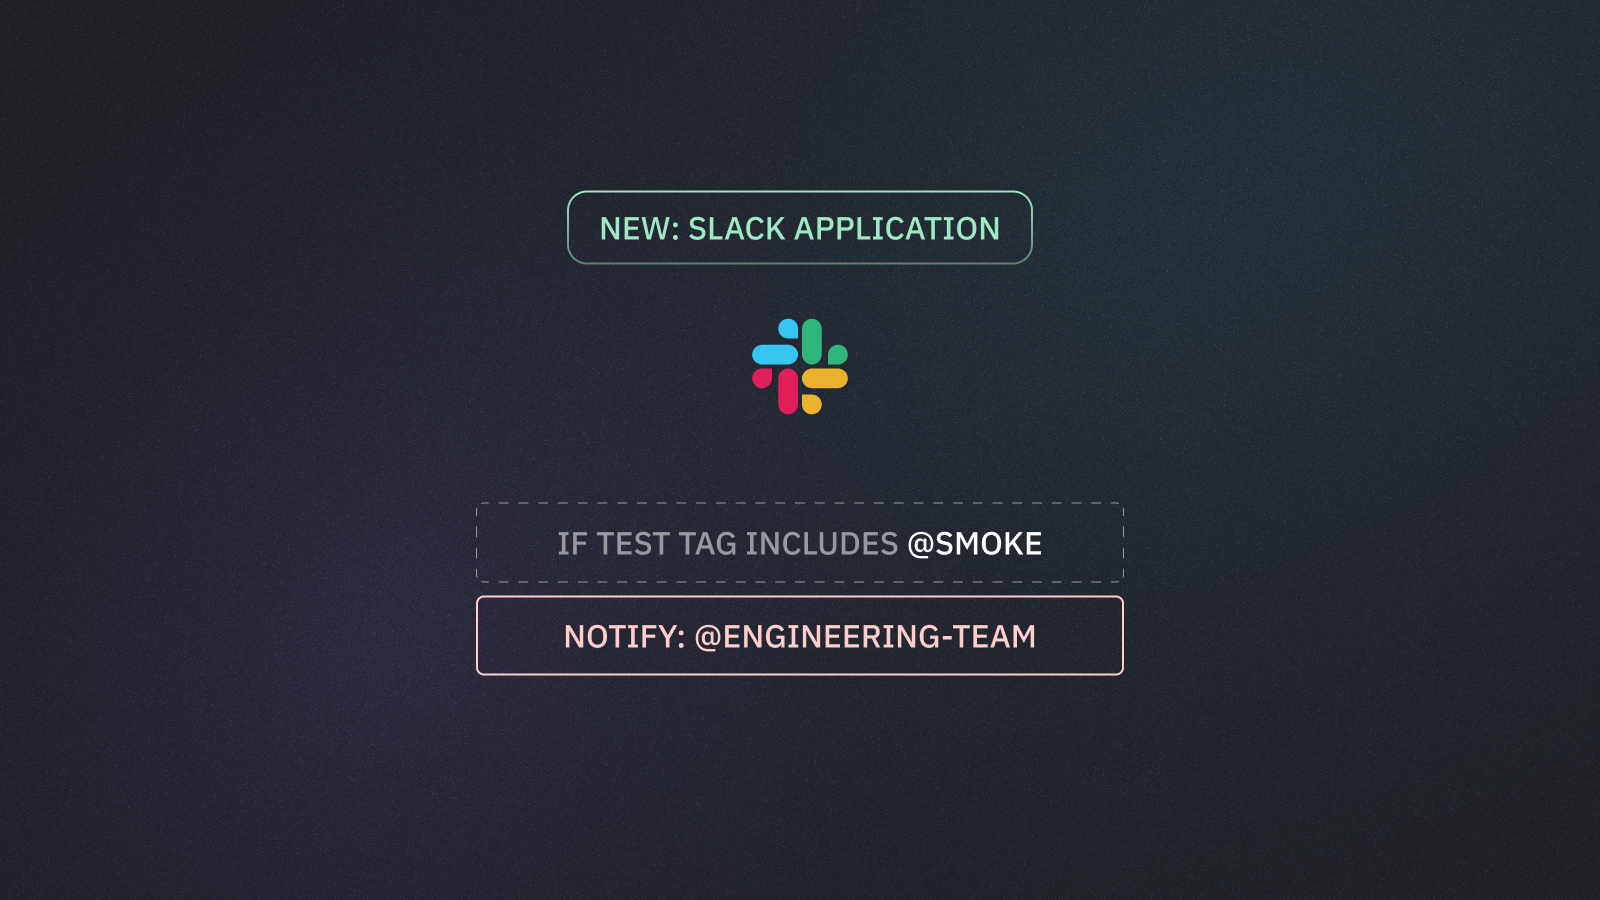
Notify Team Members and Slack Groups about failures and flaky results
Integrate Currents with Slack to receive real-time notifications and failure alerts directly in your team's channels.
The new Slack App helps teams stay informed about test results without leaving their workflow.
Threaded run notifications that keep channels organized
Individual test notifications for failed or flaky tests
Annotation-based mentions to notify the right people from test code
UI-configured mention rules to route failures to the right teams
Flexible filtering by git branch, tags, test title, and file path
Up to 10 destinations per project with independent configuration
Available now for all customers

Configure exactly when and how you're notified. Set up run notifications to alert on:
all runs
only failures, or
only flaky tests.
Add individual test notifications to get detailed failure context with error messages and direct links to the Currents dashboard.

Route failures to the right people or teams using mention rules. Define conditions like test file path or tags, then specify who gets notified—by email, Slack handle, or user group.

You can also add notify:slack annotations directly in your test code to mention specific users when tests fail.

November 4th, 2025
Improved
We’ve upgraded our automated reporting system to give you more flexibility and control! Previously, each project supported only a single automated report. Now you can create and manage multiple reports within the same project — each with its own settings, schedule, and recipients.
✨ What’s New
Multiple Reports: Create as many automated reports as you need per project.
Custom Labels: Give each report a clear name — it will also appear as the email subject line.
Report Management: Easily enable, disable, or archive reports directly from the new Reports dashboard.
October 14th, 2025
New
Improved
We’ve been quiet over the last three months, focusing on delivering major improvements to our platform. This update covers a lot — use the list below to jump to what matters most.
Analytics Engine - faster, more granular, scalable, and supporting upcoming features
Test Explorer - new columns, new API, new controls
Error Explorer - making sense of Playwright errors
Custom Metrics - report any custom metric to Currents
Data Redaction for Trace Files
Jira Integration Improvements
MCP
UI changes
New Analytics Engine
We’ve completed a major refactor of our analytics engine. Over 800 million rows were migrated to a new ClickHouse cluster — smoothly and without major incidents.
Results:
Sub-100ms P90 latency;
More detailed, real-time insights (see Test Explorer and Error Explorer)
This overhaul was essential to meet growing demand for fast, accurate, and granular data. The new infrastructure also unlocks several upcoming capabilities:
AI-powered insights across Currents Dashboard, GitHub PRs, CLI, Slack, email, and reports
Enhanced context for AI workflows — test history, health metrics, and trends
Flexible, expressive querying for fully customizable reports
Real-time health data for powering Currents Actions, MCP, and REST API integrations
Test Explorer Improvements
Test Explorer remains one of our most-used features, helping teams quickly identify unstable or flaky tests. With the recent release, it now goes beyond snapshots to reveal trends and behavioural changes over time. You can now easily see:
Which tests recently started to flake or fail
Whether your fixes actually reduced failures

Failure Rate Change — shows how failure rates shifted between two periods (e.g., last 30 days vs. previous 30 days)
Flakiness Rate Change — compares test instability over time
Read more in Test Explorer documentation.
In addition, we’ve introduced a new /tests HTTP REST API resource that allows you to fetch Test Explorer data programmatically.
Making Sense of Playwright Errors with Error Explorer
CI pipelines generate a flood of test results, and meaningful insights are often buried in noise. Error Explorer classifies and enriches Playwright errors, transforming raw messages into structured, searchable data.
For example consider exploring the top errors affecting your runs and seeing this:
Error: expect(locator).toBeVisible() failedThis message is too generic — it can be associated with different CSS selectors and doesn’t tell the full story, nor does it allow you to take action to actually remove the errors. Wouldn’t it be better to have a more precise, application-aware data? For example:
What CSS selectors or components cause the most CI failures?
Are login issues due to hidden or disabled buttons?
How many failures are infrastructure-related vs. actual test issues?
When a test fails, the raw error message and stack trace are parsed by Currents’ Error Classification Engine. It enriches every captured test error with structured fields that turn unstructured text into searchable, tokenized data.
Target (e.g. CSS selector, URL)
Action (e.g.
click,toBeVisible)Category (e.g.
Assertion,Timeout)

This structured data enables exploration from multiple angles — similar to using GROUP BY in SQL.
Now, instead of guessing what hides behind Error: expect(locator).toBeVisible() failed you can see that:
Most tests failed because
[data-testid=fg-loader]was not visible[data-testid=table-tbody….]visibility is the second most-common failure reason

Explore Playwright Error Explorer documentation.
Custom Test Metrics in Currents
Playwright has evolved beyond testing — it’s now a platform for performance, accessibility, and coverage insights. Our new analytics engine lets you track custom numeric metrics tied to your tests, such as:
Accessibility score
Lighthouse web vitals
Performance metrics
Resource usage metrics
You can attach numeric metric values to a test (as an annotation) to track it in Currents. See Playwright Custom Test Metrics documentation.
Here’s an example of sending resource usage metrics to Currents:
// Add annotations with a custom metric
test
    .info()
    .annotations.push([
    {
      type: "currents:metric",
      description: JSON.stringify({
        name: "memory_usage",
        value: getMemoryUsage(),
        type: "float",
        unit: "mb",
      })
    }, {
      type: "currents:metric",
      description: JSON.stringify({
        name: "cpu_usage",
        value: getCPUUsage(),
        type: "float",
        unit: "%",
      }),
    }]);
These metrics are automatically processed and surfaced in Currents charts — complete with filtering, aggregation, and trend analysis.

Data Redaction for Trace Files
To strengthen privacy and compliance for our Enterprise Customers, we launched an automatic removal of secrets (tokens, passwords, API keys) from trace files. This feature is available for customers on Enterprise plan.
Benefits:
Prevents accidental exposure of credentials
Simplifies GDPR and SOC 2 compliance
Reduces risk during debugging and collaboration
Read more about Data Redaction.
Improved Jira Integration
A couple of months ago we rolled out our native integration with Jira. The recent release includes a couple of improvements based on customer feedback:
Create or link an existing Jira Issue when browsing test results
Show previously linked Jira Issues
Show Jira Issue details when browsing a test
Add comment / failure details (with Markdown support) to previously linked issues
See the updated Jira Integration documentation.
Currents MCP Server 2.0

The new analytics platform enabled us to release MCP Server 2.0 released. See the Currents MCP Server documentation.
You can now ask your agent question about your testing suite:
What were the top flaky tests in the last 30 days — analyze CI test history to identify and resolve flakiness
What were the slowest specs this week — find the slowest files across recent CI executions
Moreover, you can use AI Agents + Currents MCP server to perform intelligent tasks
Fix all my flaky tests — investigate patterns in your CI pipeline failures, create a plan, and suggest fixes
Fix this test — pull the last CI test results and suggest fixes
UI Improvements
Beyond the major infrastructure and API updates, we’ve refreshed parts of the dashboard UI — addressing many of the annoyances reported by our users.
We’re deeply grateful for everyone who shares feedback, challenges, and ideas. Your input directly shapes Currents’ roadmap — and the next wave of features is already underway.