October 14th, 2025
New
Improved
Better Analytics, Error Classification, Jira Improvements and more
We’ve been quiet over the last three months, focusing on delivering major improvements to our platform. This update covers a lot — use the list below to jump to what matters most.
Analytics Engine - faster, more granular, scalable, and supporting upcoming features
Test Explorer - new columns, new API, new controls
Error Explorer - making sense of Playwright errors
Custom Metrics - report any custom metric to Currents
Data Redaction for Trace Files
Jira Integration Improvements
MCP
UI changes
New Analytics Engine
We’ve completed a major refactor of our analytics engine. Over 800 million rows were migrated to a new ClickHouse cluster — smoothly and without major incidents.
Results:
Sub-100ms P90 latency;
More detailed, real-time insights (see Test Explorer and Error Explorer)
This overhaul was essential to meet growing demand for fast, accurate, and granular data. The new infrastructure also unlocks several upcoming capabilities:
AI-powered insights across Currents Dashboard, GitHub PRs, CLI, Slack, email, and reports
Enhanced context for AI workflows — test history, health metrics, and trends
Flexible, expressive querying for fully customizable reports
Real-time health data for powering Currents Actions, MCP, and REST API integrations
Test Explorer Improvements
Test Explorer remains one of our most-used features, helping teams quickly identify unstable or flaky tests. With the recent release, it now goes beyond snapshots to reveal trends and behavioural changes over time. You can now easily see:
Which tests recently started to flake or fail
Whether your fixes actually reduced failures
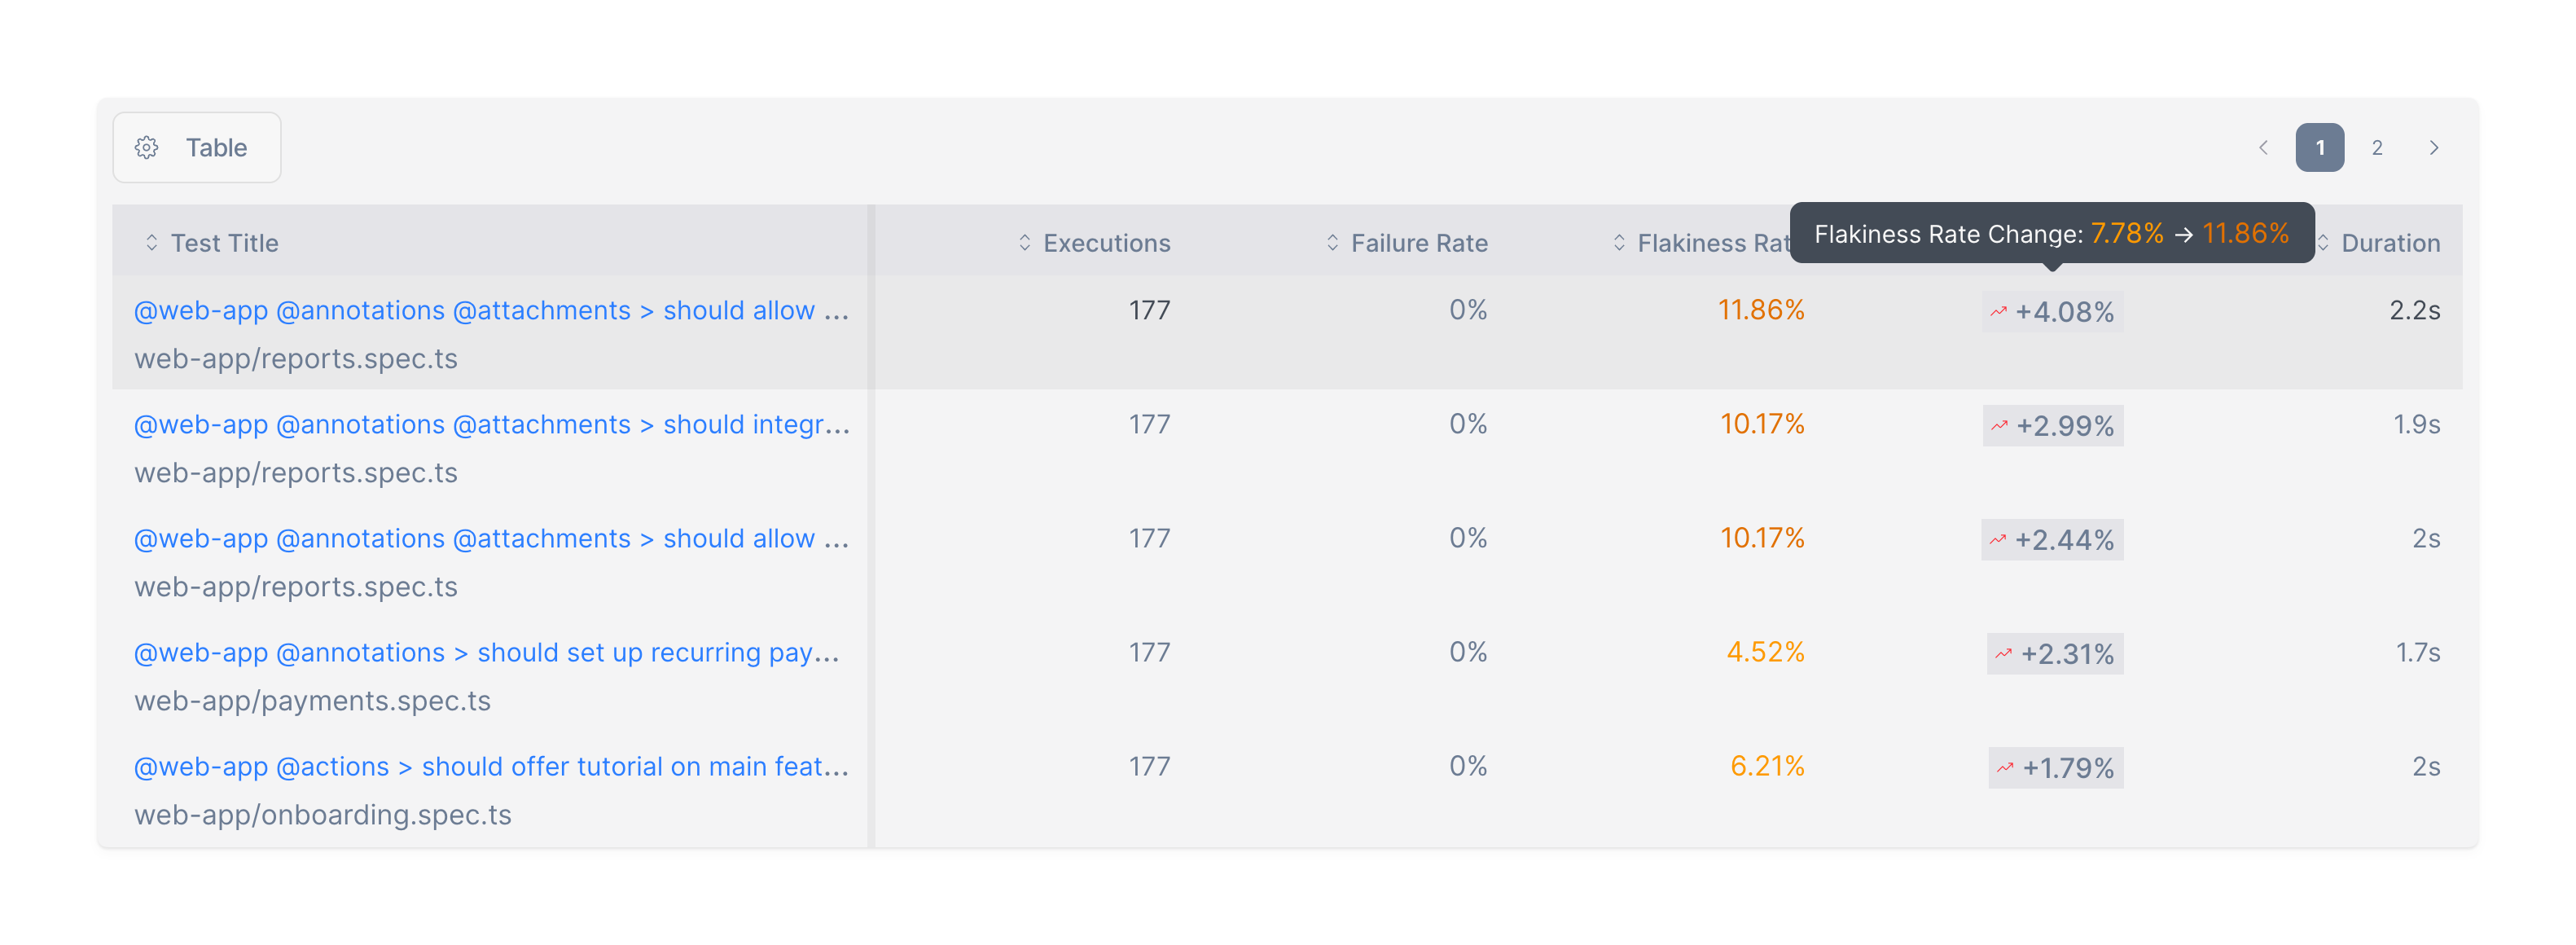
Failure Rate Change — shows how failure rates shifted between two periods (e.g., last 30 days vs. previous 30 days)
Flakiness Rate Change — compares test instability over time
Read more in Test Explorer documentation.
In addition, we’ve introduced a new /tests HTTP REST API resource that allows you to fetch Test Explorer data programmatically.
Making Sense of Playwright Errors with Error Explorer
CI pipelines generate a flood of test results, and meaningful insights are often buried in noise. Error Explorer classifies and enriches Playwright errors, transforming raw messages into structured, searchable data.
For example consider exploring the top errors affecting your runs and seeing this:
Error: expect(locator).toBeVisible() failedThis message is too generic — it can be associated with different CSS selectors and doesn’t tell the full story, nor does it allow you to take action to actually remove the errors. Wouldn’t it be better to have a more precise, application-aware data? For example:
What CSS selectors or components cause the most CI failures?
Are login issues due to hidden or disabled buttons?
How many failures are infrastructure-related vs. actual test issues?
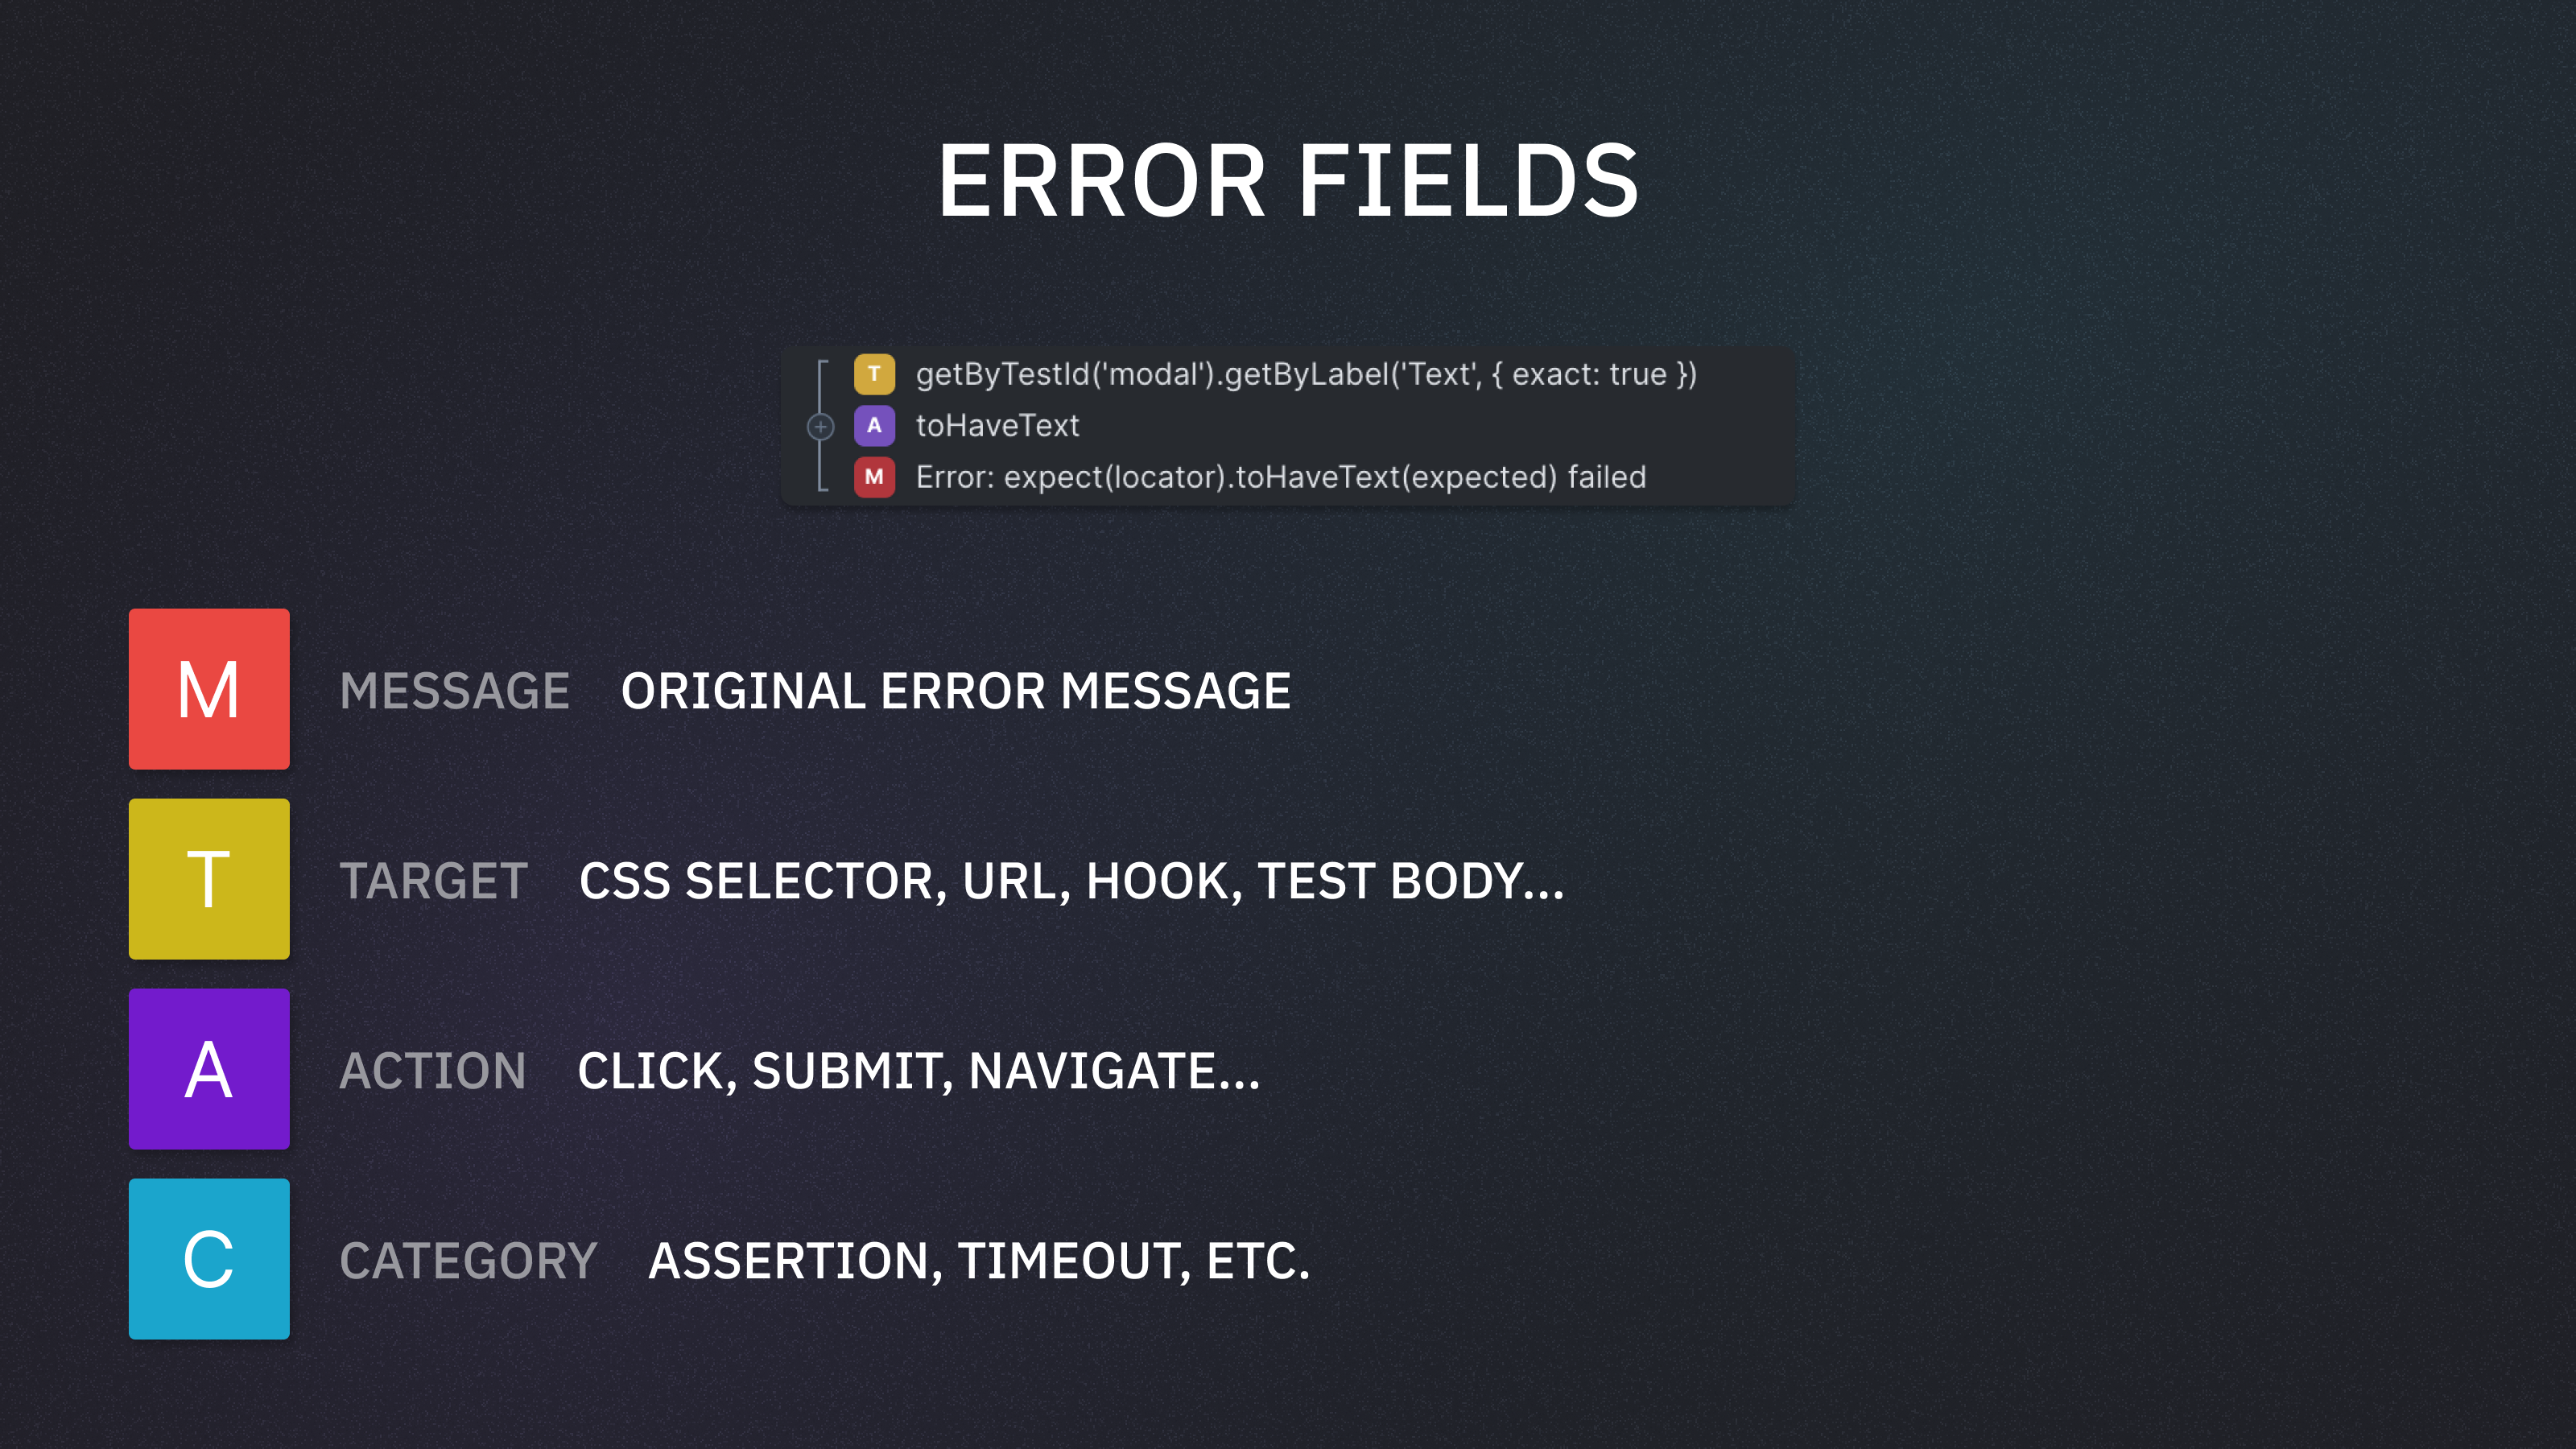
When a test fails, the raw error message and stack trace are parsed by Currents’ Error Classification Engine. It enriches every captured test error with structured fields that turn unstructured text into searchable, tokenized data.
Target (e.g. CSS selector, URL)
Action (e.g.
click,toBeVisible)Category (e.g.
Assertion,Timeout)
This structured data enables exploration from multiple angles — similar to using GROUP BY in SQL.
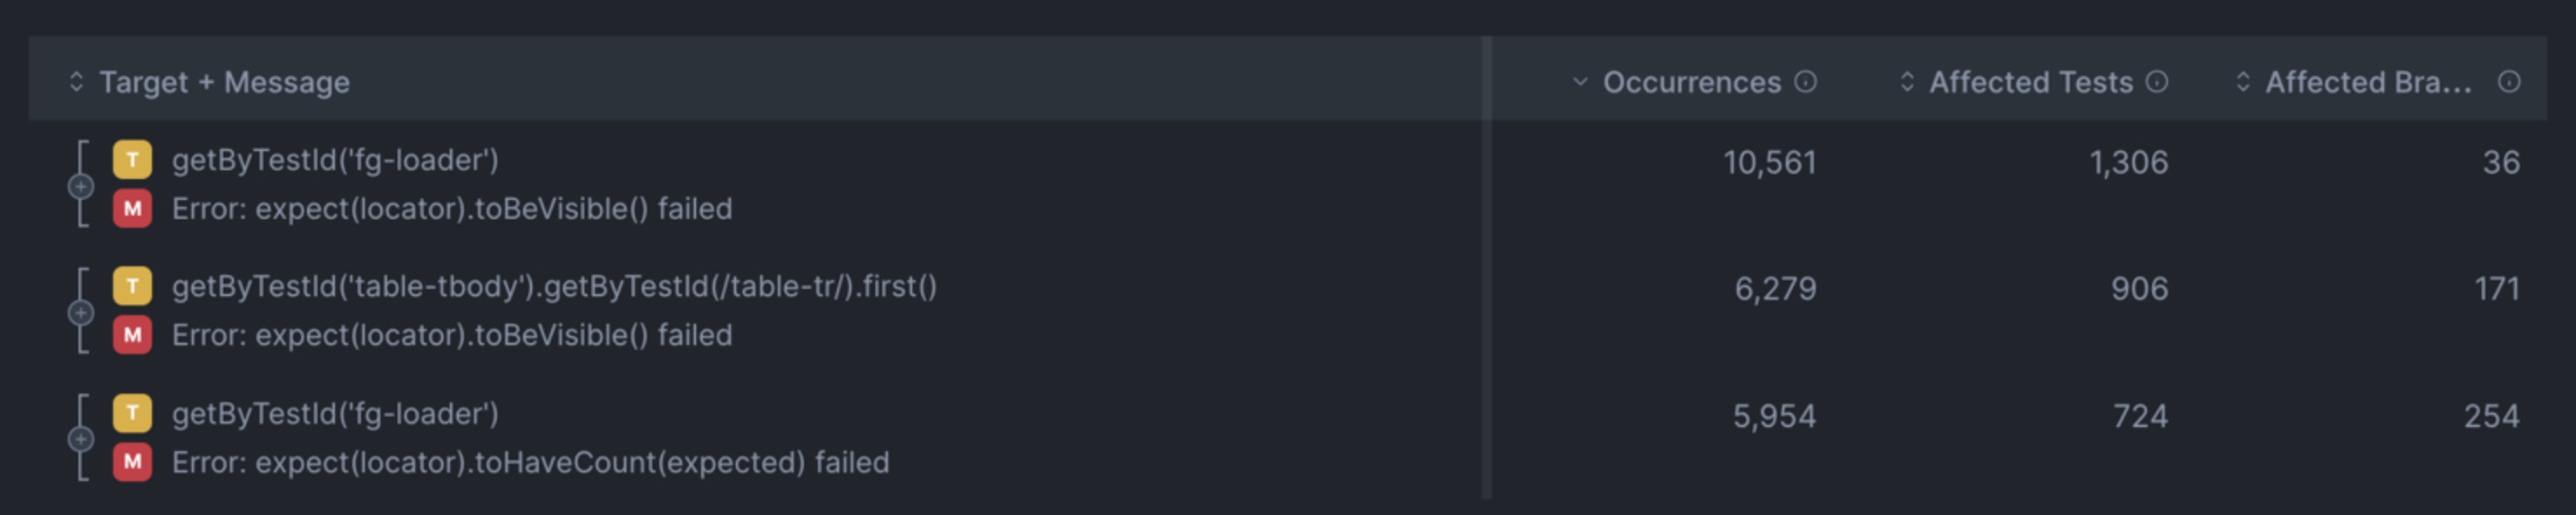
Now, instead of guessing what hides behind Error: expect(locator).toBeVisible() failed you can see that:
Most tests failed because
[data-testid=fg-loader]was not visible[data-testid=table-tbody….]visibility is the second most-common failure reason
Explore Playwright Error Explorer documentation.
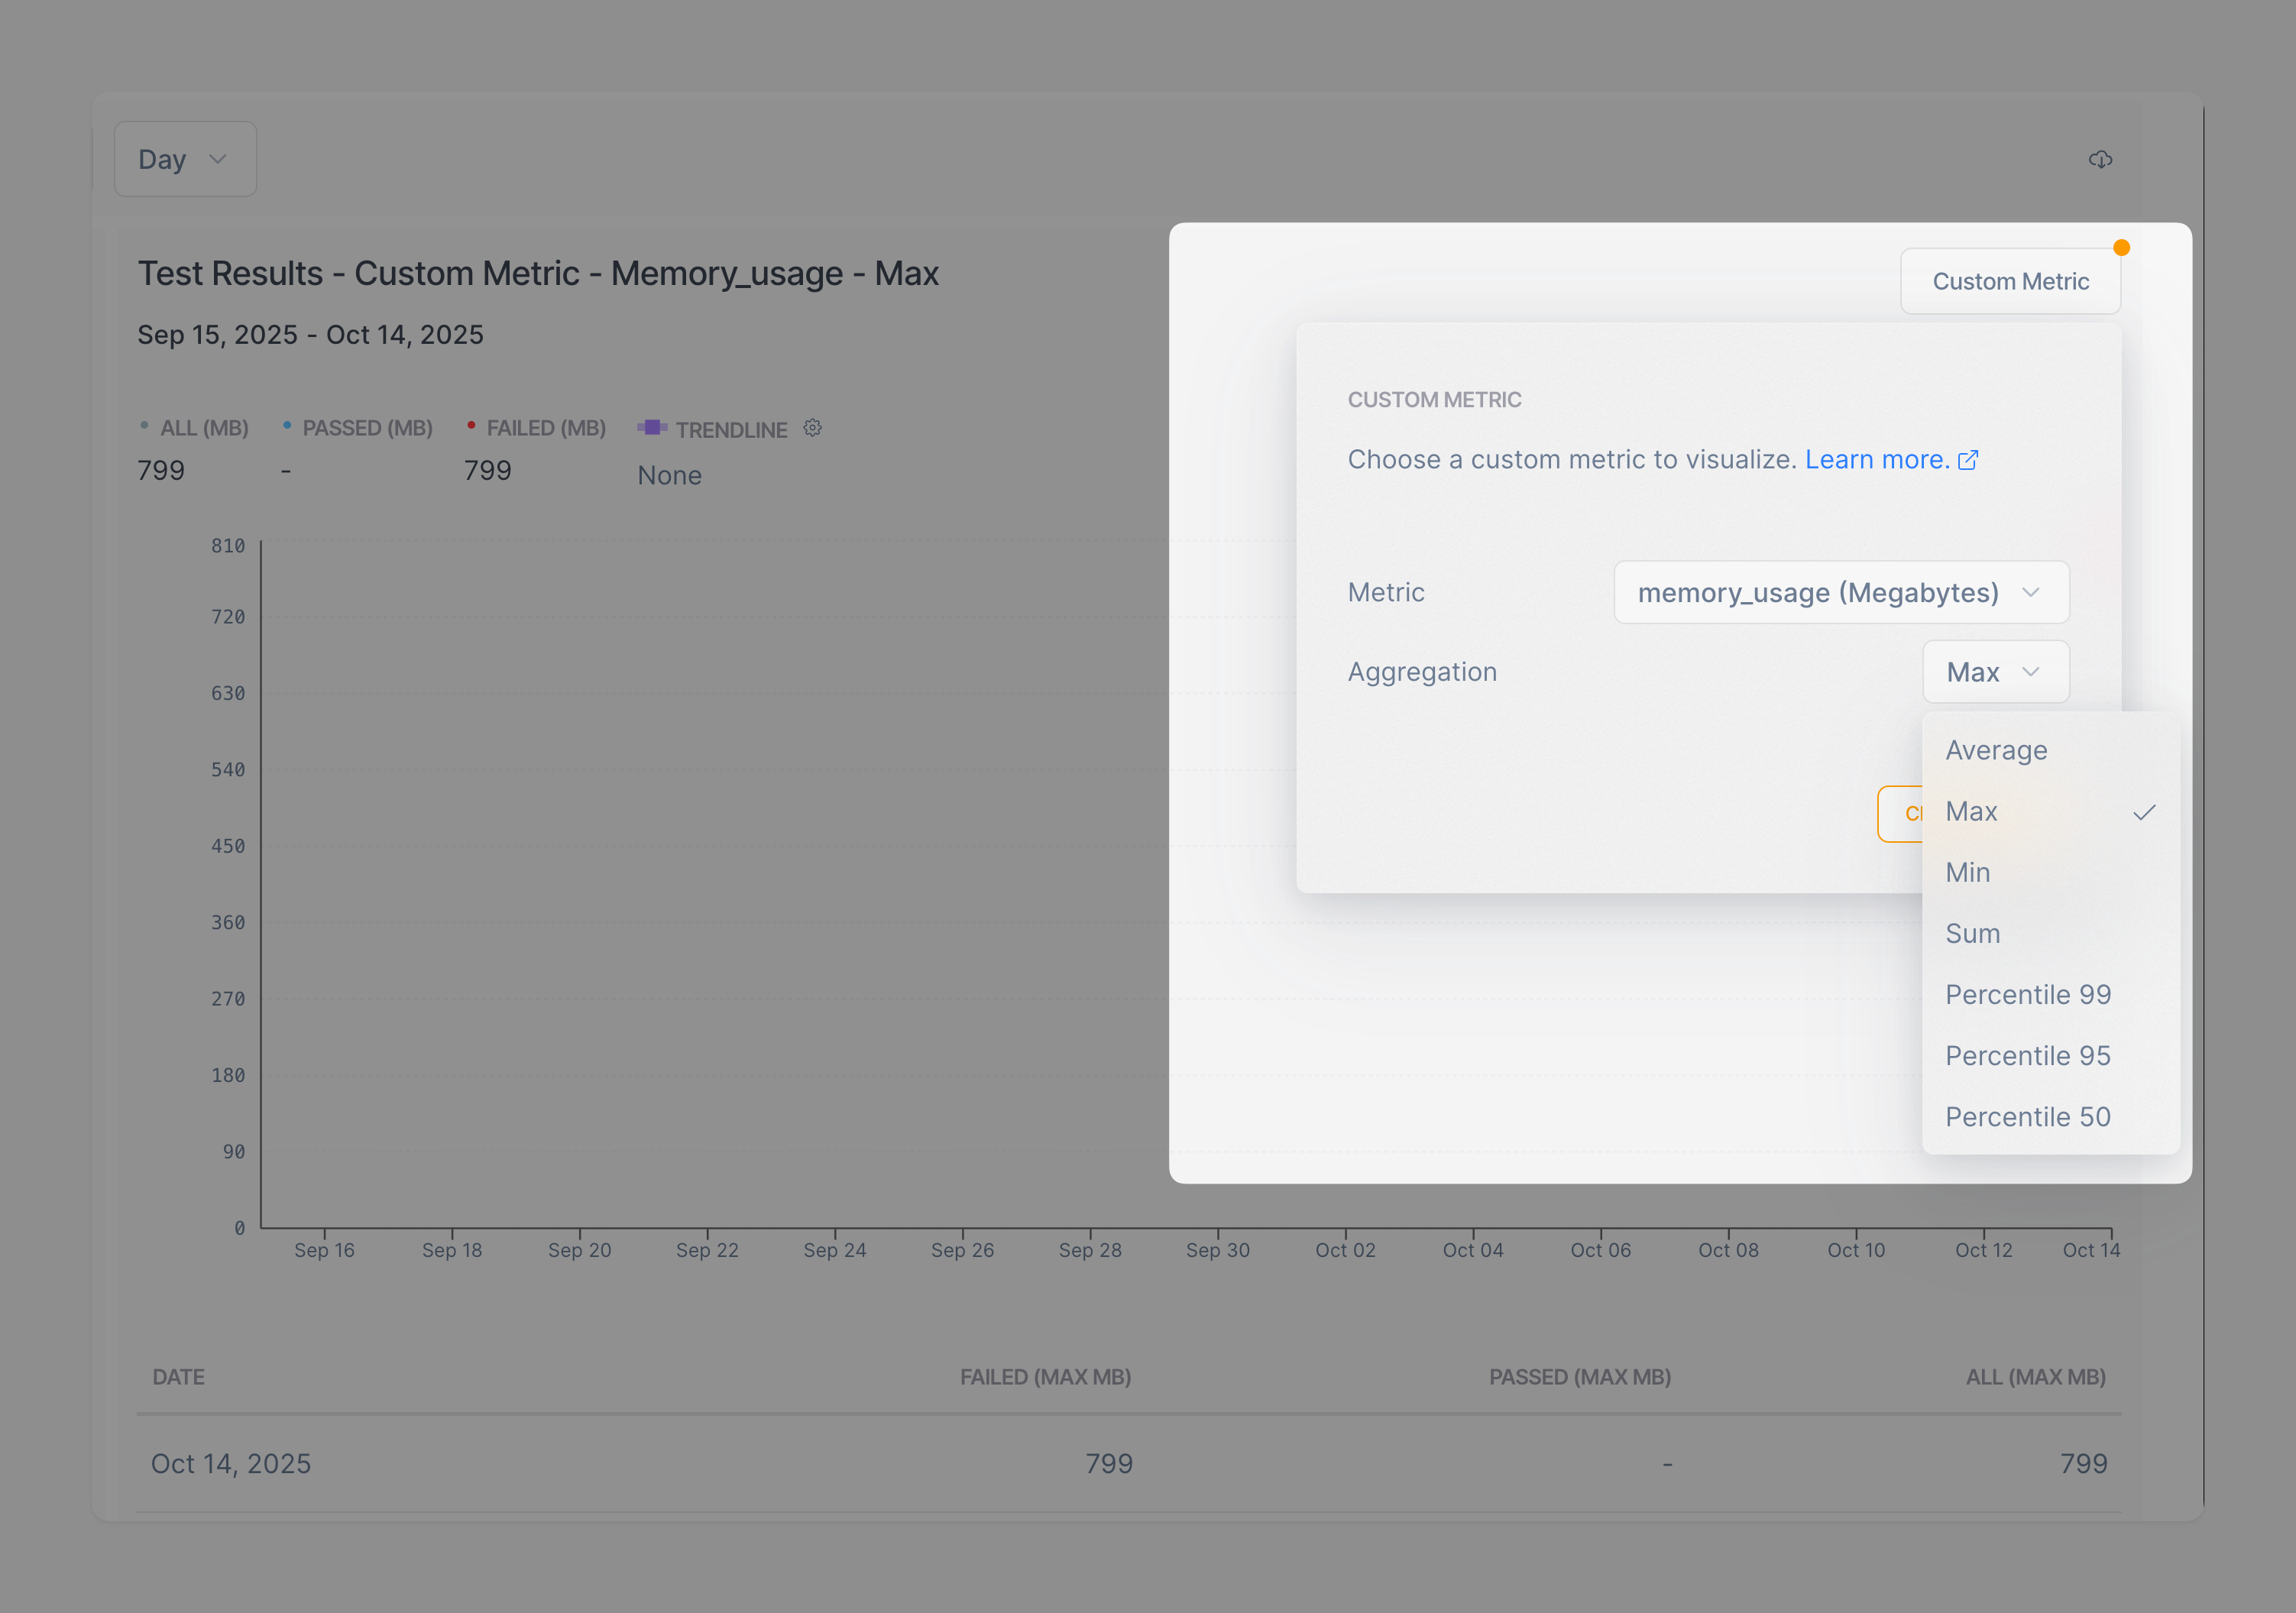
Custom Test Metrics in Currents
Playwright has evolved beyond testing — it’s now a platform for performance, accessibility, and coverage insights. Our new analytics engine lets you track custom numeric metrics tied to your tests, such as:
Accessibility score
Lighthouse web vitals
Performance metrics
Resource usage metrics
You can attach numeric metric values to a test (as an annotation) to track it in Currents. See Playwright Custom Test Metrics documentation.
Here’s an example of sending resource usage metrics to Currents:
// Add annotations with a custom metric
test
    .info()
    .annotations.push([
    {
      type: "currents:metric",
      description: JSON.stringify({
        name: "memory_usage",
        value: getMemoryUsage(),
        type: "float",
        unit: "mb",
      })
    }, {
      type: "currents:metric",
      description: JSON.stringify({
        name: "cpu_usage",
        value: getCPUUsage(),
        type: "float",
        unit: "%",
      }),
    }]);
These metrics are automatically processed and surfaced in Currents charts — complete with filtering, aggregation, and trend analysis.
Data Redaction for Trace Files
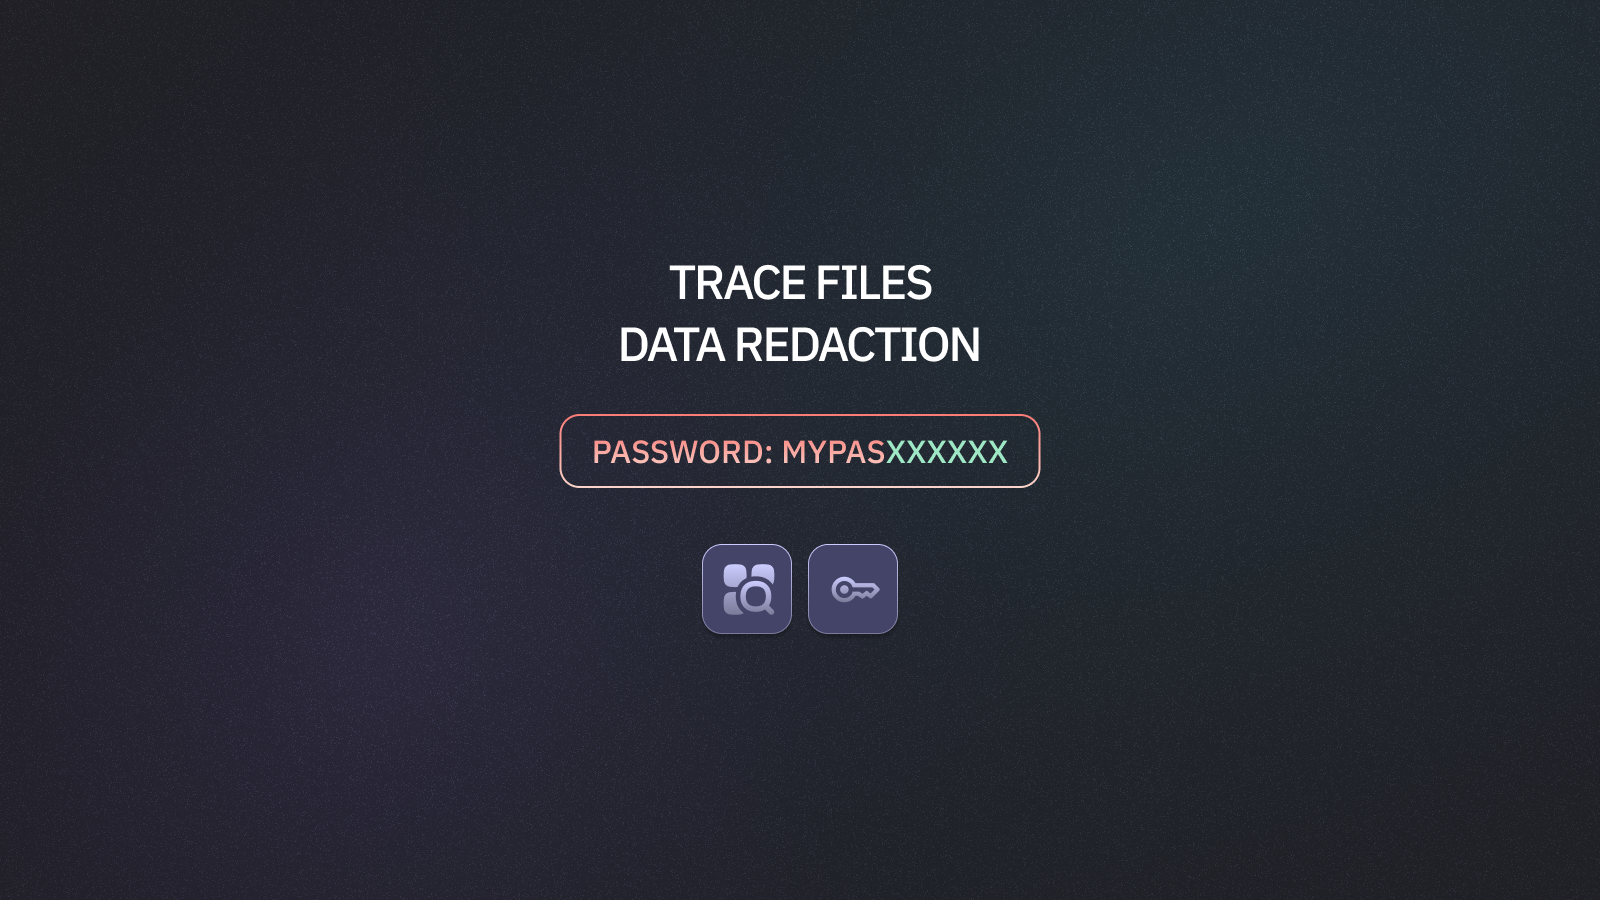
To strengthen privacy and compliance for our Enterprise Customers, we launched an automatic removal of secrets (tokens, passwords, API keys) from trace files. This feature is available for customers on Enterprise plan.
Benefits:
Prevents accidental exposure of credentials
Simplifies GDPR and SOC 2 compliance
Reduces risk during debugging and collaboration
Read more about Data Redaction.
Improved Jira Integration
A couple of months ago we rolled out our native integration with Jira. The recent release includes a couple of improvements based on customer feedback:
Create or link an existing Jira Issue when browsing test results
Show previously linked Jira Issues
Show Jira Issue details when browsing a test
Add comment / failure details (with Markdown support) to previously linked issues
See the updated Jira Integration documentation.
Currents MCP Server 2.0

The new analytics platform enabled us to release MCP Server 2.0 released. See the Currents MCP Server documentation.
You can now ask your agent question about your testing suite:
What were the top flaky tests in the last 30 days — analyze CI test history to identify and resolve flakiness
What were the slowest specs this week — find the slowest files across recent CI executions
Moreover, you can use AI Agents + Currents MCP server to perform intelligent tasks
Fix all my flaky tests — investigate patterns in your CI pipeline failures, create a plan, and suggest fixes
Fix this test — pull the last CI test results and suggest fixes
UI Improvements
Beyond the major infrastructure and API updates, we’ve refreshed parts of the dashboard UI — addressing many of the annoyances reported by our users.
We’re deeply grateful for everyone who shares feedback, challenges, and ideas. Your input directly shapes Currents’ roadmap — and the next wave of features is already underway.